St. Jude Family of Websites
Explore our cutting edge research, world-class patient care, career opportunities and more.
St. Jude Children's Research Hospital Home

- Fundraising
St. Jude Family of Websites
Explore our cutting edge research, world-class patient care, career opportunities and more.
St. Jude Children's Research Hospital Home

- Fundraising
Overview
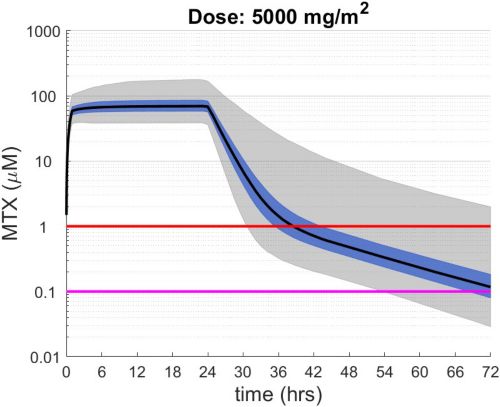
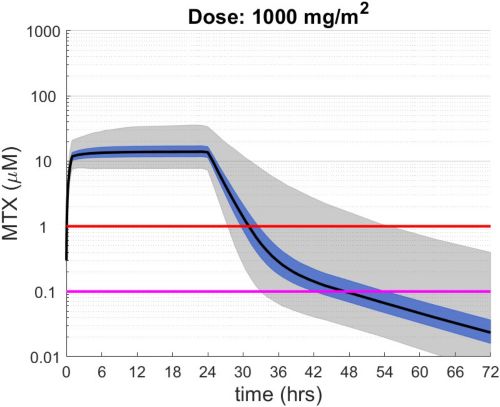
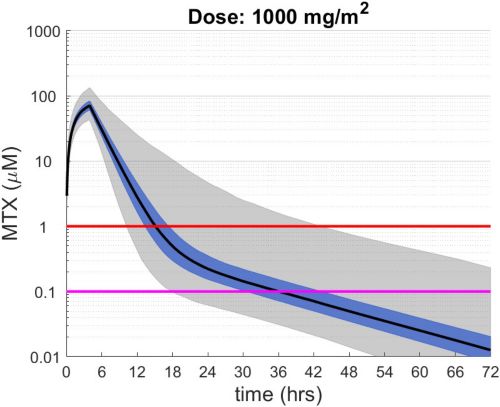
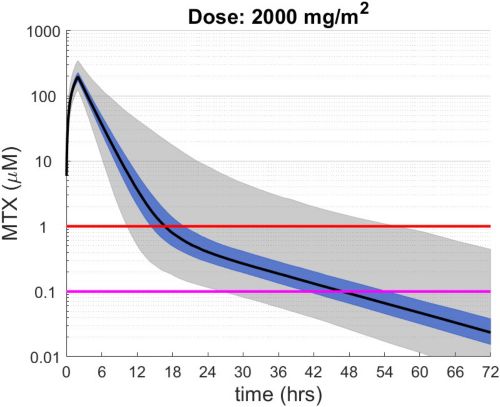
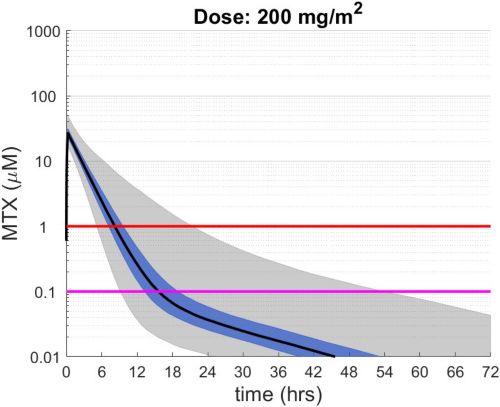
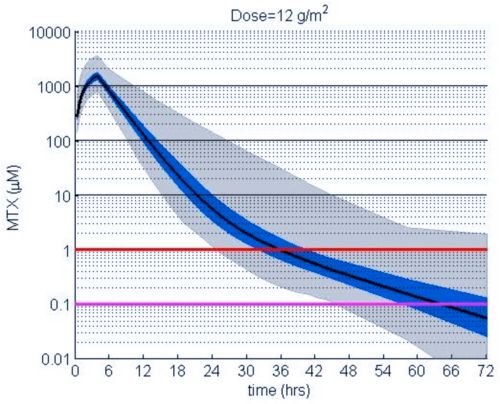
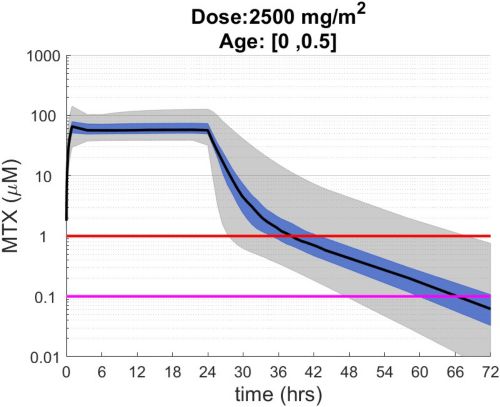
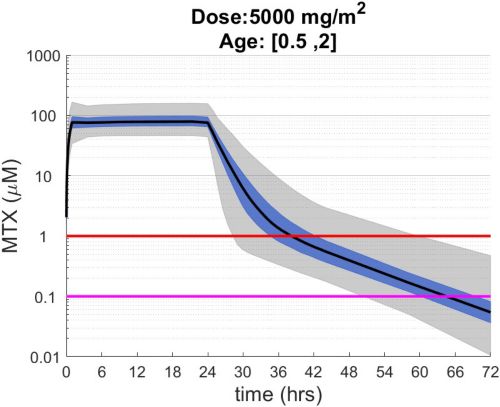
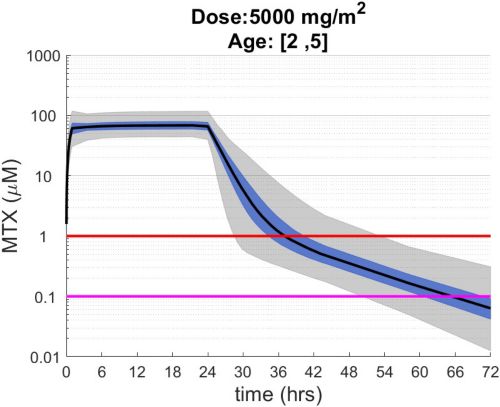
These simulations indicate the plasma concentrations (median, 25-75th percentiles, and 1st-99th percentiles) expected for patients with observed MTX PK parameters derived from St. Jude Children’s Research Hospital studies including: TOTAL 17 frontline pediatric ALL; SJYC07 for infant and young children with newly diagnosed brain tumors; and MIOS, OS86, OS91, and OS2008 osteosarcoma. The frontline pediatric ALL study included 485 patients (age 1 to 19 years old) with normal MTX excretion patterns and doses of MTX ranging from 0.5 to 8.2 g/m2 infused over 24 hours. The infant and young children brain tumor study included 178 patients (age 0.02-4.7 years old). The osteosarcoma studies included 172 patients (age 3 to 24 years old) with normal MTX excretion patterns and a MTX dose of 12 g/m2 infused over 4 hours. These studies were performed in a center with real-time PK monitoring and adjustments in hydration and alkalinization were made as clinically needed.* Less aggressive hydration, alkalinization, and lack of real-time monitoring might produce plasma MTX concentrations different from those estimated in these graphs. In addition, each MTX treatment regimen may differ in recommended thresholds for leucovorin rescue, and thresholds for clinical action should not be inferred from the data presented.
Methods
The MTX pharmacokinetic parameters used in the simulations were determined by fitting a two-compartment pharmacokinetic model with first-order elimination to each course of each individual’s MTX concentration time data. Details of the clinical trials and the pharmacokinetic analysis are described in the below listed references.* Descriptive statistics of the estimated pharmacokinetic parameters: V (L/m2); Ke (1/hrs); Kcp (1/hrs); and Kpc (1/hrs) along with clearance (CL=(50/3) · Ke · V, ml/min/m2) are given in the table. Estimates of MTX exposure: Area under the concentration vs time curve from 0 to 72 hrs (AUC, μM · hr); and end of infusion, 24 hr, and 44 hr concentrations (μM) were determined based on the model estimated concentrations for each course. Descriptive statistics of these parameters are given in the table. The percentage of courses with a 44 hr concentration greater than 1.0 μM was determined using the model estimated 44 hr MTX concentration. The plot shows the median (black curve), 25th-75th percentile (blue shaded region), and 1st-99th percentile (grey shaded region) model estimated MTX concentration with respect to time.
Leukemia Protocols
Osteosarcoma Protocols
Infant Protocols
References
- Cancer 2004 Apr 15;100(8):1724-33. https://doi.org/10.1002/cncr.20152
- Br J Clin Pharmacol. 2020 Feb;86(2):362-371. https://doi.org/10.1111/bcp.14160
Related topics
Disclaimer
The data on this website, such as text, graphics, images, and other information ("Content") are for informational purposes only. The Content is not intended to be a substitute for professional medical advice, diagnosis, or treatment, and it should not be relied upon by anyone, including medical professionals, for patient management decisions. Always seek the advice of your physician or other qualified health provider with any questions you may have regarding a medical condition.
